Final Project:
Power Point Presentation of: Belmont, East Pueblo, Colorado Real Estate
Final Test:Final Exam Advanced Stats
Final Project:
Power Point Presentation of: Belmont, East Pueblo, Colorado Real Estate
Final Test:Final Exam Advanced Stats

More Multiple Regression:
Database #1:
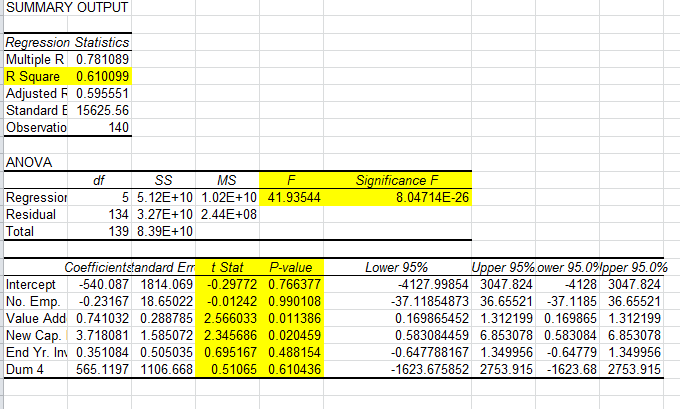
This Regression Model is from the Manufacturing Database to predict Cost of Materials by Number of Employees, New Capital Expenditures, Value Added by Manufacture, and End of Year Inventories. The model is somewhat strong; as the r-squared is .609; the f test and the significance are at decent levels. Some of the variables are stronger predictors then others as you can see in the t-stat and the p value; the best predictor is the value added by Manufacture.

Database #2:
Regression Model using the financial database: This regression model is weak! The variables that seem to be the best predictors are the Dividends per Share and the Total Assets. As you can see the r-squared is very low; the f test and the significance are weak.

Database #3: International Stock Market Database:
This regression model is fairly significant; and med-strong. The r-squared; the f-test and the significance of f are all med-strong. There are a few predictors that are better than others, the predictors that are good for this regression model are: the FTSE; DJIA; and the Hang Seng.

Database #4:
Annual Food Spending by Annual Income and Non-Mortgage Household Debt Regression Model. The model is decent in strength. The f test is really good, and so is the significance of f. The predictor that seems stronger is the annual household income; because its T-stat and P value were better, when I ran a regression model for just the annual household income and the annual food spending the regression model didn’t change very much.

Lesson 14: Estimate Pueblo County Votes by Candidate
Pueblo County:
56,443 voters in Pueblo County
Democrat: 30,874
Republican:23,509
Other: 2060
Fremont County:
16,239 voters in Fremont County
Democrat: 5,359
Republican:10,393
Other: 487
City and County of Broomfield:
20,791 voters in City and County in Broomfield
Democrat: 10,728
Republican:9,502
Other: 561
Saguache County:
2,170 voters in Saguache County
Democrat: 1,312
Republican:743
Other: 114
References:
http://www.nytimes.com/newsgraphics/2014/senate-model/methodology.html
http://www.city-data.com/county/Fremont_County-CO.html
http://www.nytimes.com/newsgraphics/2014/senate-model/comparisons.html
http://www.cnn.com/ELECTION/2010/results/individual/#mapSCO
http://www.politico.com/2012-election/results/president/colorado/
Election Forecasting Project Part 1: Estimate Voter Turnout: 2014
Pueblo County:
Population: 161,451
24% of Population cannot vote: Under 18; non citizens; and convicted felons. =38,784
161,451-38,784 =122,703 Eligible voters.
Estimated that 46% of eligible voters will vote. 122703* .46 = 56,443 voters in Pueblo County
Fremont County:
Population: 46,451
24% of Population cannot vote: Under 18; non citizens; and convicted felons. =11,148
46,451-11,148 = 35,303 eligible voters.
Estimated that 46% of eligible voters will vote. 35,303* .46 = 16,239 voters in Fremont County
City and County of Broomfield:
Population: 59,471
24% of Population cannot vote: Under 18; non citizens; and convicted felons. =14,273
59,471-14,273= 45,198 Eligible Voters.
Estimated that 46% of eligible voters will vote. 45,198* .46 = 20,791 voters in City and County in Broomfield
Saguache County:
Population: 6,208
24% of Population cannot vote: Under 18; non citizens; and convicted felons. =1,480
6,208-1,480= 4718 eligible voters.
Estimated that 46% of eligible voters will vote. 4,718* .46 = 2,170 voters in Saguache County
Lesson 12:
Assignment: Complete Problem 15.8 on p. 617 and Problem 15.12 on p.624
15.8:

15.12:

Measurement of Forecast Error: MAD, MSE and Bias
Assignment: Complete Problems 15.2, 15.4 on p.607
Assignment 15.2: 

15.4:
To Get the Bias/MAD and MSE you have to divide the total of the column by the number of indicators.


